What differentiates integrators that use dashboards in Q360 from those that don’t?
Today, Tofiq Indawala, Director of Product Management, is joined by Brad Malone from Navigate Management Consulting to talk about dashboards in Q360.
How do Solutions360 customers use dashboards?
“A lot of integrators traditionally just look at the day-to-day operation and don’t understand what direction the ship is actually heading,” says Indawala. “They’re dealing with a lot of spreadsheets, a lot of data, a lot of information. But when you look at data in that manner, it’s harder to visualize where you’re going, and where you’ve been. That’s where the dashboards really come into play, by giving you the ability to look at how the data is trending, and how your business is trending against your goals.”
If you have a goal, your dashboard should tell you if you are hitting that goal.
Having dashboards allows you to see your whole business, and segment it into manageable KPIs, or steppingstones to reach those goals. What is our trajectory for hitting our goals? This is very important.
“The difference is, are we just dealing with putting out fires and the day-to-day operations,” asks Indawala. “OR, are we moving beyond that, to really measure the growth and the success of the business?”
“One of the things I really believe, is that each individual in the organization, should have a dashboard with their particular key performance indicators,” says Malone. “Everybody ought to be moving the organization towards that goal.”
“Absolutely,” Indawala continues. “Navigate talks about the whole concept of cascading metrics and KPIs and that’s exactly what dashboards in Q360 provide. We could start with an executive dashboard. How is the whole company performing, as well as the different business units? Each manager from each business unit, or functional area should have their own KPIs that lead up to the main objective, or the overall goals of the integrator.”
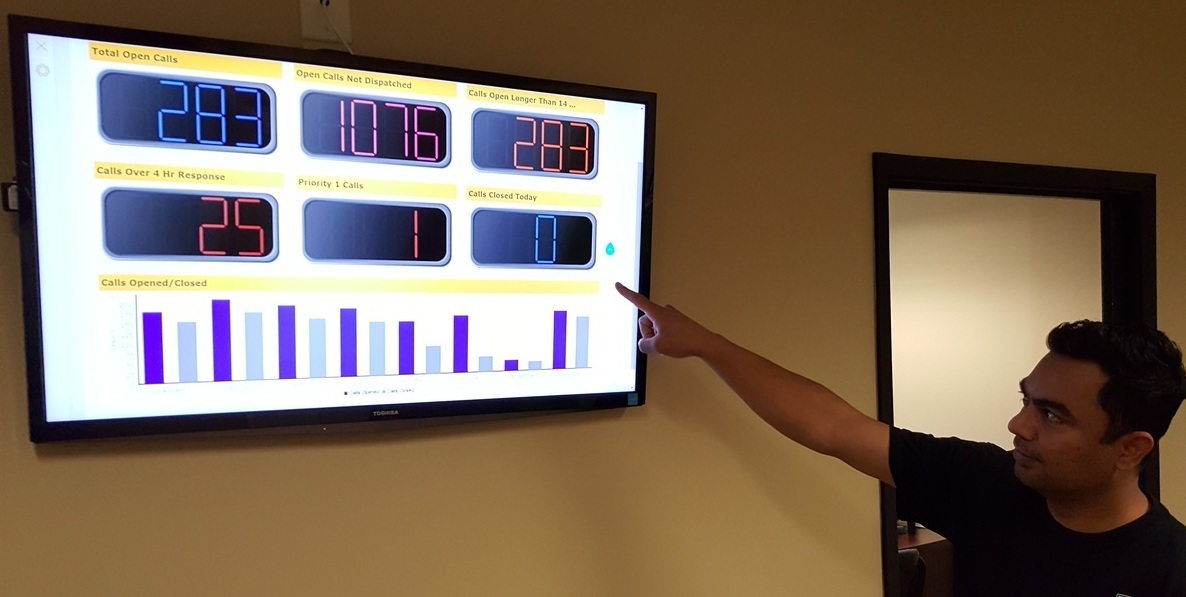
Dashboards in Q360 turn data into information.
“As people, we cannot just take all the raw data and visualize it,” says Indawala. “We need tools like dashboards and KPIs. When you’re taking that data and putting it into visual perspective, then we can consume that information. We can digest that information and make sense out of it.”
Watch the video for the full discussion:
Dashboards in Q360 ERP Software
Handpicked Related Content: Keeping Score in Your Integration Business
Handpicked Related Content: Q360 Helps Spinitar Develop Metrics to Create Accountability