Interactive dashboards in Q360 allow individuals at different levels of an integration business, to influence change, and make better (more profitable) decisions.
Tofiq Indawala, Director of Product Management for Solutions360, recently joined Brad Malone on the Navigator Podcast, to announce the launch of our new interactive dashboards.
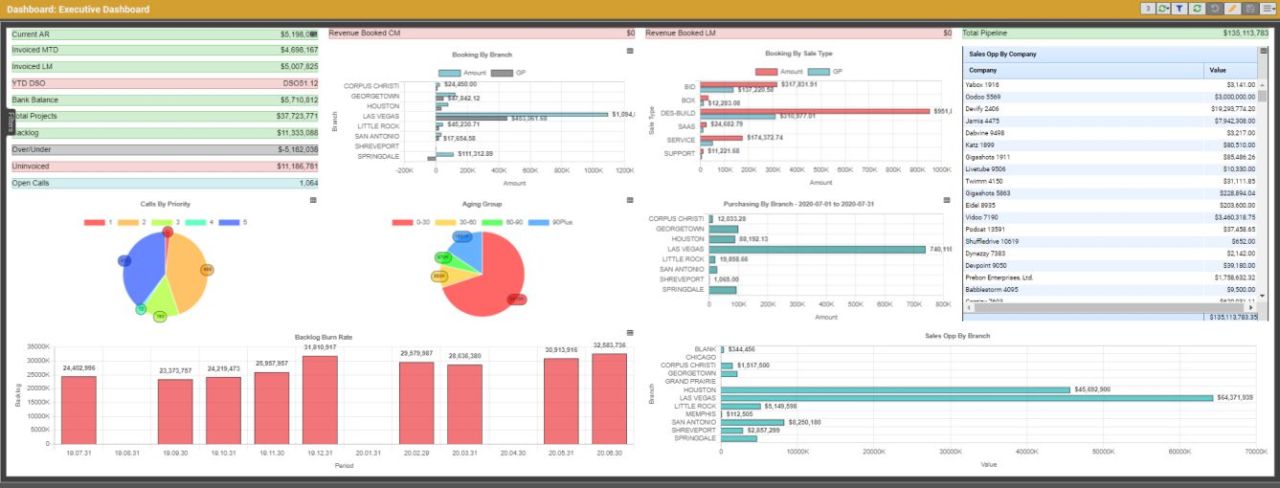
Traditionally, dashboards have been designed as more of an executive tool for making business decisions. But Solutions360 customers wanted to have access to meaningful and important management dashboards for every facet of the organization.
“The dashboards are by far the most fun that I’ve had in 15 years at Solutions360 and we are excited to deliver this functionality to our customers,” says Indawala. “In the past, our customers had to rely on third party systems, or business intelligence tools like Power BI, to take their data and turn it into information. Now this capability is available directly in Q360.”
Solutions360 customers can now take their data, build charts and graphs, and use that information to make important business decisions.
“Our customers have been waiting very impatiently. We have early adopter programs that have been testing the dashboards for the last few months. But the official public release came with version 10.3, which gives access to all the dashboards and a report designer. So far, our customer are loving it,” says Indawala.
How do Q360 customers use the dashboards on a daily basis to run their business?
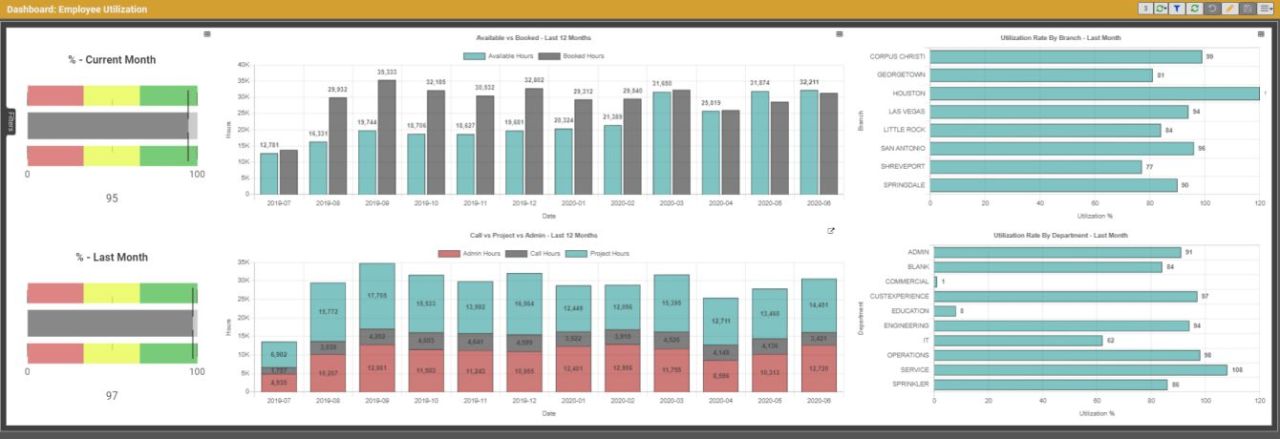
Using the Labor Utilization Report, an Operations Manager or a Sales Manager can understand what is forecast to happen with their labor demands over the next six months. So, they can make better decisions on how to best utilize their resources, how to shuffle their resources, or even if they need to hire more resources or revenue and cost projection on projects.
Can we do our own installs with our current resources, or do we need to hire subcontractors to fulfill the customer demands?
Interactive dashboards allow integrators to run their businesses more proactively as opposed to a reactively.
It’s kind of like putting a kid in a candy store.
What KPIs should you run?
What data should you look at?
And the answer is, it should be tied to the strategic goals of your integration business.
Where does an integrator want to be in the next two to five years?
What are some of the challenges your integration business is facing?
We recommend taking a handful, say four or five dashboards or KPIs, to see how your organization is performing in comparison with your strategic initiatives.
This new functionality is going to be a game changer.
“We want to make sure that the information in the dashboards is measurable and actionable, to help you make informed business decisions,” Indawala concludes.
Listen to the podcast for the full discussion:
Solutions360 New Interactive Dashboards with Tofiq Indawala
Handpicked Related Content:
Handpicked Related Content: